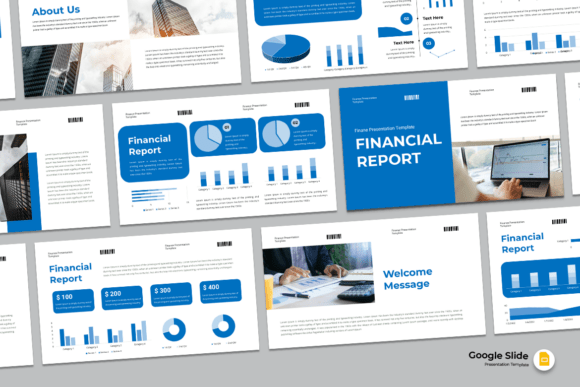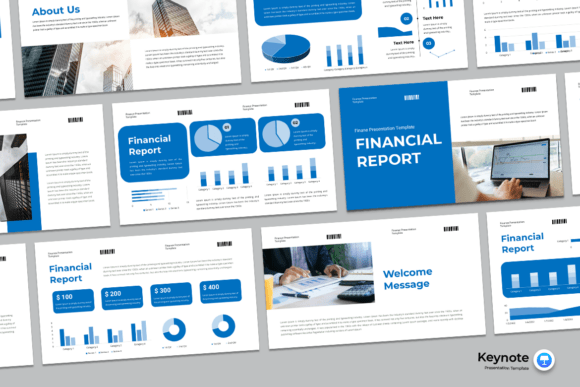
Financial Report - Keynote Template: Streamlining Data Presentation Workflows
Presenting financial data requires a delicate balance between analytical precision and visual clarity. Stakeholders, investors, and team members need to grasp complex fiscal narratives quickly without getting lost in spreadsheet grids. The Financial Report - Keynote Template serves as a critical bridge in this communication process, transforming raw numerical data into a compelling strategic story. Rather than viewing this asset merely as a collection of slides, professionals should approach it as a standardized framework that accelerates the reporting cycle while maintaining brand consistency and visual integrity.
In modern business workflows, the friction often lies not in gathering data, but in formatting it for consumption. This template addresses that bottleneck by providing a pre-structured environment designed specifically for fiscal storytelling. With 15 distinct master slide layouts in a 16:9 ratio, it offers enough variety to cover quarterly earnings, annual reviews, budget forecasts, and investor pitches without requiring custom design work for every new report. The inclusion of drag-and-drop photo placeholders and fully editable shapes allows users to focus on the accuracy of their message rather than the alignment of text boxes.
Integrating the Template into Financial Planning Cycles
The utility of the Financial Report - Keynote Template extends across different phases of business planning and review. Understanding where it fits within your existing workflow ensures that the tool enhances productivity rather than adding an administrative layer.
Pre-Reporting Preparation and Data Structuring
Before opening Keynote, effective preparation involves auditing your source data against the available slide masters. Because this template includes unique custom slides tailored for financial contexts, you can structure your Excel or CSV exports to match the intended visualization. For example, if the template features a specific layout for year-over-year growth comparison, organize your dataset to highlight those exact metrics. This reverse-engineering approach prevents the common issue of forcing incompatible data into ill-fitting charts. During this phase, verify that all necessary fonts are installed from the included package to prevent rendering issues later in the process.
Active Reporting and Stakeholder Communication
During the actual presentation creation, the template’s master slide functionality becomes the primary efficiency driver. Instead of formatting individual slides, users apply global changes through the master layout. If your organization updates its color palette or logo mid-quarter, adjusting the master slide propagates these changes across all 15 slides instantly. This feature is particularly valuable for teams where multiple contributors might be working on different sections of a comprehensive financial report. The drag-and-drop image replacement capability also streamlines the integration of qualitative elements, such as team photos or product imagery, which help humanize dry financial figures during board meetings or client updates.
Post-Presentation Archiving and Iteration
After the presentation is delivered, the template serves as a baseline for future reporting cycles. Save a clean, unpopulated version of the Financial Report - Keynote Template as a master file in your digital asset management system. This creates a single source of truth for financial presentations, ensuring that next quarter’s report maintains visual continuity with previous ones. Over time, this consistency builds cognitive ease for recurring stakeholders who learn to associate specific slide layouts with particular types of financial insights.
Technical Compatibility and Asset Management
Seamless integration depends on understanding the technical specifications and limitations of the asset. While the template is designed for ease of use, certain practical considerations ensure smooth operation across different environments and devices.
- Font Dependency: The package includes free fonts that must be installed prior to editing. Failing to install these will result in font substitution, potentially breaking the layout of financial tables or headers. Always check the "Read Me" or documentation included in the package before beginning edits.
- Image Licensing: It is important to note that images are not included with the template. The placeholders serve strictly as positional guides. Users must source their own photography or stock assets. Ensure any external images used comply with licensing requirements, especially for public-facing investor decks or published annual reports.
- Cross-Platform Behavior: While optimized for Apple Keynote, users exporting to PDF or PowerPoint for cross-platform sharing should verify that transparency effects and custom fonts render correctly. The 16:9 aspect ratio is universally compatible, but complex shape layers may require adjustment when converting between proprietary formats.
- Master Slide Integrity: Avoid unlocking master slides unless absolutely necessary. Keeping elements locked within the master layer preserves the template's structural integrity and makes future bulk edits significantly faster.
Optimizing Visual Hierarchy for Financial Clarity
A template provides the container, but the user must provide the clarity. When utilizing the Financial Report - Keynote Template, prioritize information hierarchy over decorative density. Financial audiences scan for key performance indicators (KPIs) before reading supporting text. Use the template’s bold typography and color-blocking features to guide the eye toward the most critical numbers first.
Leverage the editable shapes and color systems to create semantic meaning throughout the deck. For instance, assign a specific accent color to represent positive variance and another for negative variance, applying this logic consistently across all 15 slides. This reduces the cognitive load on the audience, allowing them to interpret trends intuitively. The template’s flexibility allows you to strip away non-essential elements; just because a placeholder exists does not mean it must be filled. White space is a functional component of financial design, providing the visual breathing room necessary for processing dense information.
Collaborative Workflows and Quality Control
For agencies, finance departments, and freelance consultants, this template facilitates smoother collaboration. By standardizing the presentation layer, teams can decouple content creation from design execution. A financial analyst can populate the data fields and select appropriate chart types, while a designer focuses solely on refining the narrative flow and visual polish. This division of labor is only possible when the underlying template is robust and predictable.
Quality control processes should also be adapted to leverage the template’s structure. Create a checklist that corresponds to the master slide layouts. Verify that all currency symbols are consistent, decimal places align vertically in tables, and color coding matches the established legend. Because the template uses master layouts, fixing a systematic error (such as a misaligned axis label) can often be resolved in one click rather than through tedious slide-by-slide corrections. This efficiency gain compounds over multiple reporting periods, freeing up significant time for analysis and strategic advisory work.
Expanding Your Presentation Ecosystem
While the Financial Report - Keynote Template covers fiscal specifics, broader organizational needs may require complementary assets. Professionals often benefit from curating a library of interoperable templates that share similar design languages or grid systems. Visiting the provider’s profile to explore additional presentation templates can help build a cohesive suite of tools for marketing, operations, and HR communications. Maintaining visual consistency across different business functions reinforces brand identity and professional credibility.
When selecting additional templates, look for those that offer similar master slide architectures and font packages. This interoperability ensures that assets can be mixed and matched without creating a disjointed viewer experience. For freelancers and consultants managing multiple clients, having a reliable set of base templates reduces setup time for new projects and allows for rapid customization based on client branding guidelines.
Practical Implementation for Diverse User Groups
The application of this template varies depending on the user's role and objectives. Entrepreneurs pitching to venture capitalists may utilize the more dynamic, high-level summary slides to demonstrate market traction and burn rate, focusing on the narrative arc enabled by the custom layouts. In contrast, corporate finance managers preparing internal budget reviews might rely heavily on the data-dense table layouts and detailed breakdown slides to facilitate granular discussion.
Educators and trainers teaching financial literacy can use the template as a pedagogical scaffold. The clear separation of visual elements helps students distinguish between different types of financial statements and metrics. By using a professional-grade template in educational settings, instructors also model industry-standard communication practices, preparing learners for real-world business environments.
For small business owners wearing multiple hats, the template acts as a force multiplier. It eliminates the need to hire a designer for routine financial updates while still producing output that looks professionally crafted. The key is to resist the urge to over-customize; the template’s value lies in its pre-designed effectiveness. Trust the layout decisions made by the template creators, and focus your energy on ensuring the underlying financial data is accurate and the accompanying commentary provides genuine insight.
Ultimately, the Financial Report - Keynote Template is a productivity tool disguised as a design asset. Its true ROI is measured not in aesthetic appeal alone, but in the hours saved during production, the reduction in formatting errors, and the increased confidence with which financial stories are told. By integrating this resource thoughtfully into your operational workflow, you transform the often-dreaded task of financial reporting into a streamlined, repeatable, and strategically valuable process.